Problem:
Most databases, be it provider databases with comprehensive clinical metrics or more traditional prescriber databases, lack the proper construction to discern probable cause.
Such data lack relevant clinical context. As a result, law enforcement and prosecutors are left to extrapolate interpretations with an incomplete set of information. This has led many to focus on overdose events and total prescription quantity. Unfortunately, many studies have repeatedly shown little to no correlation between prescriptions written and overdose mortality.
Yet, the persistent narrative correlating the two has led to misguided policies among health leaders and law enforcement worsening clinical outcomes among the most vulnerable patients, those with chronic pain and with substance use dependencies.
Solution:
Create a framework whereby data can be analyzed in a contextualized manner reflecting clinical behavior.
Background:
Currently, we look primarily at two metrics, prescription quantity and overall overdose mortality. We then equate the relationship between these metrics with a fixed financial correlation, ostensibly derived as a loss of economic productivity from the loss of life.
Such calculations provide a limited perspective on the scope of the opioid epidemic. It focuses only on the most overt, acute metric – mortality – and fails to incorporate equally germane, though more subtle clinical metrics. We must now look beyond traditional metrics to understand the broader, more accurate scope of impact – which you will find in complex clinical metrics that model two discrete sets of clinical actions relative to one another.
The opioid epidemic is fundamentally a medical issue, not a legal one. And by attempting to resolve a complex medical problem through standardized legal rubrics, you will inevitably produce errors in approximation. It is why we see a poor correlation between opioid prescriptions and overall mortality.
The federal government has developed overly simplified models that approximate the financial impact of the opioid epidemic upon patients’ lives and decision-making through economic valuations of fatality risk reduction – the “value of a statistical life” relative to patient mortality.
However, we now know the limitations in equating the value of individual patient lives based on how a patient trades wealth creation for mortality risk reduction. Simply put, a person’s life is more than an estimate of economic output.
These economic valuation models oversimplify the relationships in healthcare – particularly by assuming a linear relationship between patient decisions that produce positive economic output and decisions that increase mortality.
Healthcare relationships are fundamentally complex and cannot be defined through false attributions of cause and effect which define such linear relationships.
Instead, we should study complex patterns of clinical decision-making through substitution patterns that define both provider and patient tendencies.
Specific patient tendencies can be elucidated through unique, multiform substitution patterns that characterize clinical behavior and pertinent behavioral changes. When applied to the opioid epidemic, these tendencies arise through a series of substitution patterns that lead patients to become addicts or addicts to become patients – and the determining factors that play a disproportionate role in influencing the substitution patterns seen in the behavior manifest in the pattern functions.
The varying prescribing and usage rates of different opioids, the ratio of prescription opioid mortality to heroin or fentanyl mortality, and the decision to substitute heroin for fentanyl examples of substitution patterns that define patient tendencies – which configure into pattern variances that when applied across large patient populations define the overall behavior within each healthcare ecosystem.
Healthcare ecosystems are local geographies which contain similar patient behaviors and tendencies. We can define it as an entire county, or it can be part just one urban metropolis. The size of the ecosystem matters less than the similar patterns seen within a geographic scope.
This is an important point, and should influence how resources are allocated and utilized over time. Healthcare ecosystems are regions where communities have been affected by similar environmental and clinical factors, implying that distribution of resources should be allocated similarly.
Creating complex metrics and defining healthcare ecosystems:
Carl Sagan defines intelligence as the ability to solve complex problems in changing circumstances. So to study the changing, complex relationships instigating and exacerbating the opioid epidemic, we must structure each relationship as a ratio, comparing the relationship between two connected behaviors in healthcare, and observing the patterns of behavior relative to one another.
Healthcare is a coordinated web of relationships balancing in equilibrium, held together by the bonds that define the interactions of a healthcare ecosystem. The variance patterns in these ratios discern meaningful fluctuations that define patient substitution patterns underlying the complex patient tendencies.
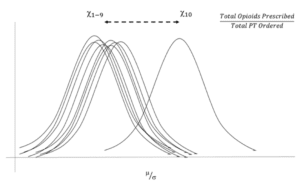
Exhibit 1 shows a hypothetical case of ten physicians in an ecosystem observed over one year. The ratio of opioids prescribed relative to the number of physical therapy orders placed is relatively constant for 9 out of the 10 physicians. The one outlier physician, whose behavior is different, warrants closer investigation to determine the underlying behaviors that produce different patterns. If all the physicians see similar patients, and have equal access to physical therapy providers, then each physician should behave similarly – and prescribe opioids and place physical therapy orders at similar rates.
Similar behavioral ratios, when applied to patient behaviors and decision-making, can be studied across healthcare ecosystems to analyze the relative impact of the opioid epidemic across various patient populations. These ratios can correlate clinical decisions relative to financial impact and economic output, that when superimposed upon each other, define the true scope of the financial, clinical and economic burdens imposed upon patients within each healthcare ecosystem.
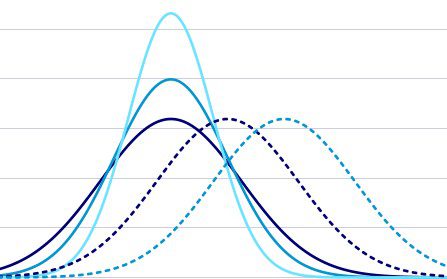
We can superimpose multiple patterns onto one another to observe diverging trends among different patterns underlying similar ratios that compare the same set of patient behaviors and decisions. It defines the disproportionate burdens of one ecosystem relative to another – and can determine the relative distribution of funds from one ecosystem relative to another.
Analyzing patient behavior as a series of clinical decisions made over time relative to different financial and economic metrics frames patient decision-making in its proper context – as an opportunity cost. And ratios that define this relationship define the complexity in healthcare, and the complex impact the opioid epidemic has had on different communities across this country.
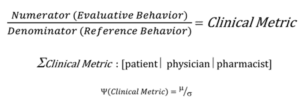
Exhibit 2 defines the structure of the ratio. The numerator is the evaluative behavior, the behavior we are observing, and the denominator is the reference behavior, the behavior that provides the context through which we understand the evaluative behavior being observed. And together, the numerator and denominator create a clinical metric. This is a critical point to glean, as patient interactions are best understood as ratios – as a relationship of one clinical behavior relative to another.
Relationships, when visualized across ecosystems, form variance patterns that can be seen through normalized patterns of distribution. And the dispersions seen in the pattern variances reveal emanative and emergent trends that define the relative influence of the opioid epidemic on patient behavior within each ecosystem.
Exhibit 3 lists examples of ratios you can use to create this framework.
Conclusion:
I hope this framework helps you to understand that true clinical undue burdens go beyond traditional metrics of mortality, beyond presumed economic loss models, and beyond overall prescription numbers. Instead of using the same erroneous financial and legal metrics, we should use more accurate, representative clinical metrics – an entire repository of clinical metrics – to understand the full impact of the epidemic on patients.
And to define the full extent of undue burdens in a systematic, fair and equitable manner – and help you individualize the dissemination of funds across different healthcare ecosystems.
While it is the shared belief in the rule of law and good clinical care that brings us together, it is the unique differences among patients across the country that define true justice for those disproportionately affected by the opioid epidemic.
Exhibit 1

Exhibit 2

Exhibit 3
Evaluative Behavior
Top ICD-10 codes
Emergency room visits
Emergency room visits leading to hospitalizations
Insurance mix
Insurance to cash pay mix
Imaging studies ordered
Prior authorizations ordered
Number of urine drug screens performed
Number of referrals to pain specialists
Mix of opioids prescribed
Opioids to non-opioids prescribed for select medical conditions (pain)
Reference Behavior
PMPM
Cost to charge ratio
Complaints to medical licensing board
Cost per urine drug screen
Cost per patient visit
Total reimbursement
Patients seen per week
Regional per capita medical spend
Unemployment rate
Residential housing breakdown
Labor market breakdown
Employer coverage relative to Medicaid care plan coverage
Average household income
Percent of population with college degrees


